Another graphical anomaly is foreshadowing a recession (& lower mortgage rates)
If you’ve been following me, then you’ve heard me harping all summer long on how the interest rate markets are out of whack. With each passing month, more signals pop up to remind us that we are not in normal economic times.
Earlier this month, The Fed held their Federal Funds Rate steady at 5.5%. This is the highest level since 2001, but how high it is RELATIVE TO other interest rates is what makes things so odd.
Below is a line showing the “spread” (simply known as the difference) between the rate on a 10-yr US Treasury Bond and the Federal Funds Rate. Typically, the 10-yr bond rate is higher than the Federal Funds Rate, making the spread a positive number. In fact, from 2002-2022, the spread has been negative for only 20 months during those 20 years.
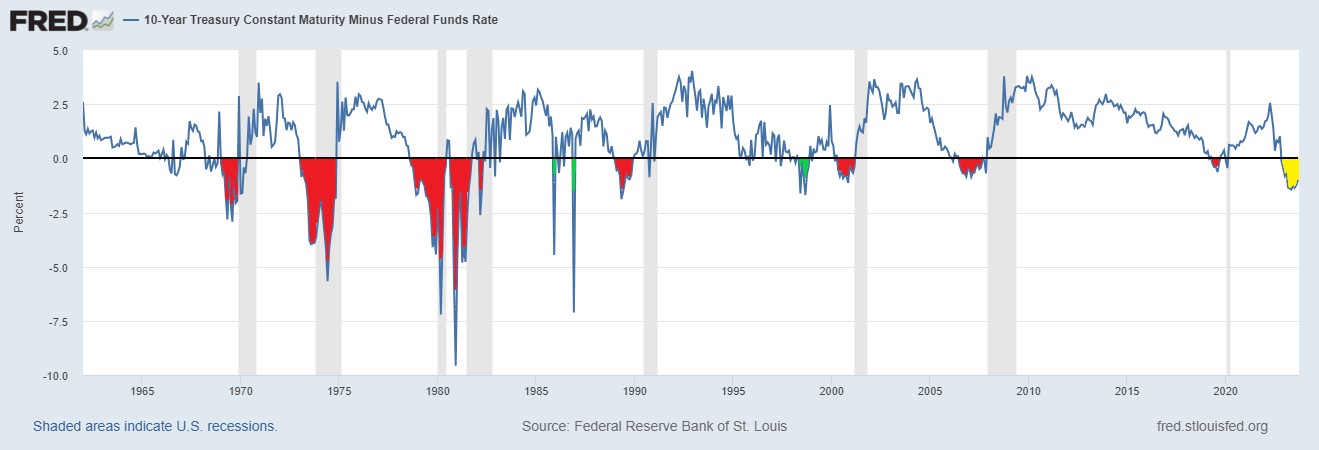
But occasionally the Federal Funds Rate increases to unusually high levels, and this spread becomes a negative number. I’ve color-coded those extended negative territories in red, and you can see that a recession has shortly followed every time (illustrated by the gray vertical bands on the timeline). We have escaped a recession despite a negative spread a few times (shown in green), but those were for very brief periods before the spread quickly jumped back into positive terrirory.
Presently, we have witnessed a negative spread between the 10-yr bond rate and the Federal Funds Rate for nearly a year (yellow area on the chart). This is foreshadowing another upcoming recession, but the silver lining is that mortgage rates ALWAYS drop during recessionary times.
When will the recession hit? When will mortgage rates fall? I have some thoughts on that, but will save them for my next post. Thanks for reading, and stay tuned for more.

2 thoughts on “Something’s STILL Wrong With Spreads”